Exercise: Classify an image in QGIS
For issues, bugs, proposals or remarks, visit the issue tracker.
Tutorial Data Set
We will use several images:
- WINDOWED_SPOT_XI_VIETNAM_011.tif, etc.. for predicting
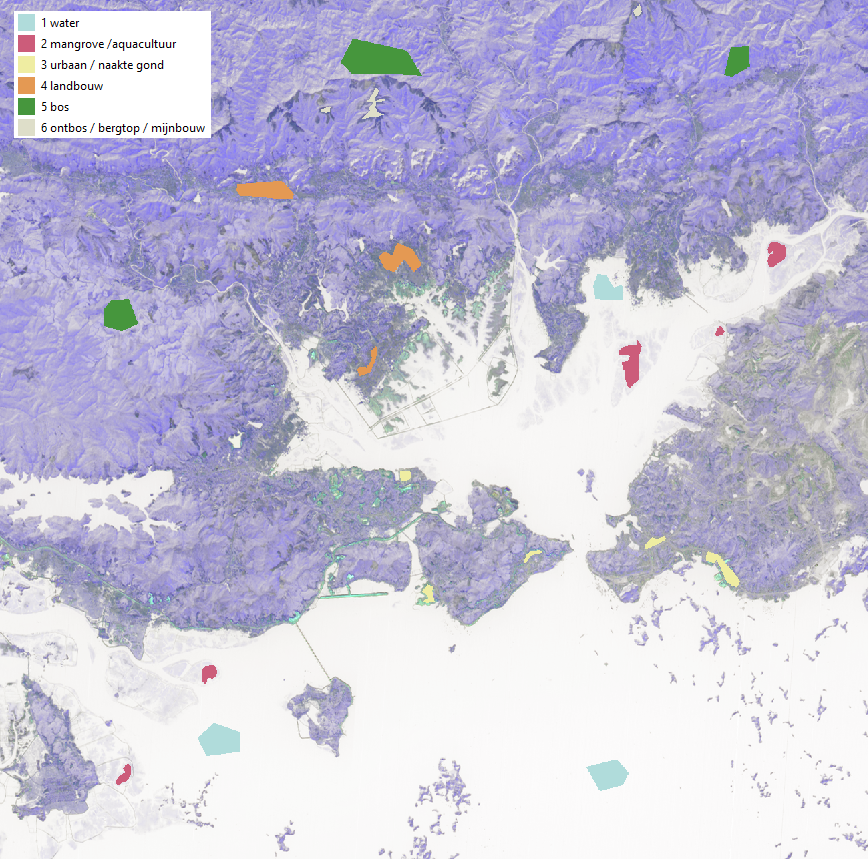
- reference.tif for training.
We have several tif images at our disposal: band 11, 12, 13 and 14 all saved as separate bands, we have an image with band 11 and 12, and an image with all 4 bands.
The classification in the reference.tif file is the following:
- 1: Water
- 2: Mangrove/aquaculture
- 3: Urban/bare white ground
- 4: Agriculture
- 5: Forest
- 6: Mountaintops/mining
- 0: No data
Goal
We will do a supervised classification MLP Classifier.
Hint
Use the style file in the exercise folder (classification_style_raster.qml) for easy styling.
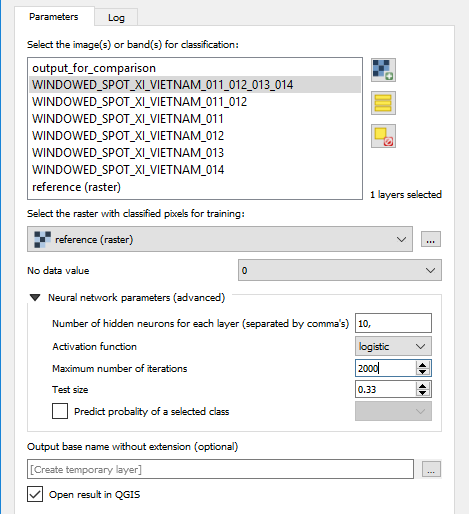
Run the Neural Network MLPClassifier in QGIS
We need the following input for the GUI:
- The image for classification: make sure you select either the image with 4 bands, or the 4 separate bands, … but do not select them twice!
- The raster for training: reference.tif
- Number of iterations: 2000
- No-data-value: 0 (do not forget to set this one!)
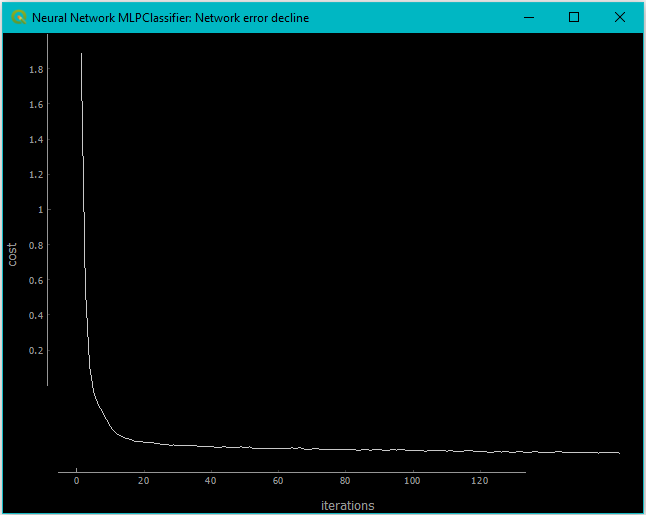
After the training, the network error is shown as a plot like:
The resulting image should look something like this:
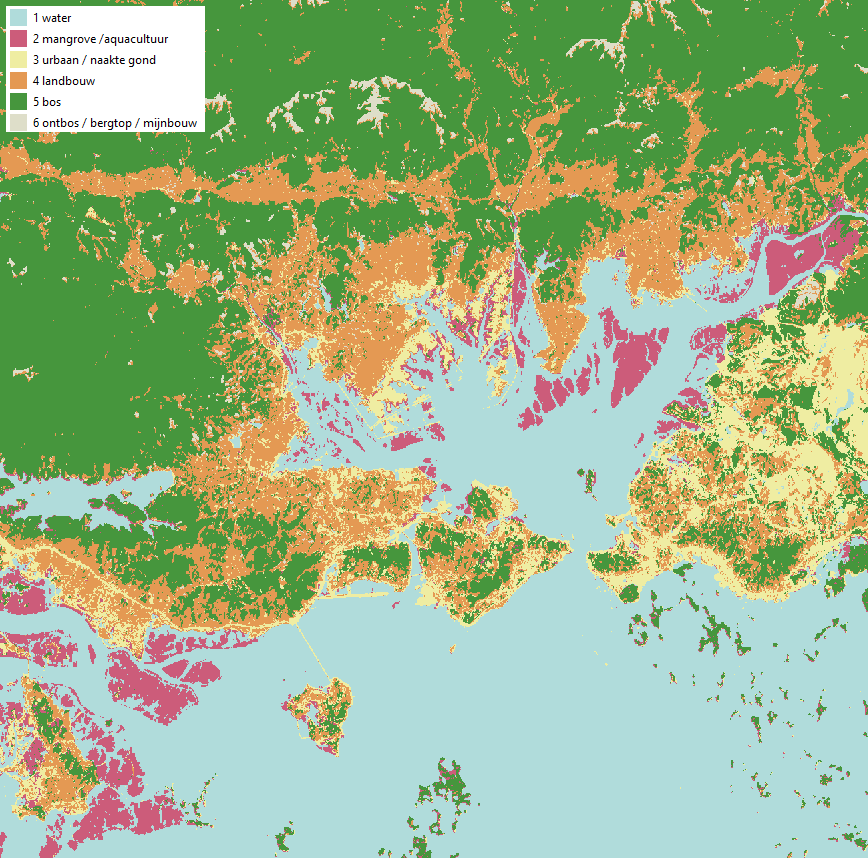
You will also get an output on the log screen with the classification kappa
Average accuracy: 0.9804091040046097
Kappa class 1: 0.999608231804873
Kappa class 2: 0.998816901840517
Kappa class 3: 0.943025695066823
Kappa class 4: 0.9422660833150642
Kappa class 5: 0.9909993784914707
Kappa class 6: 0.8952379269755105
Average Kappa: 0.961659036249043

              precision    recall  f1-score   support

           0       1.00      1.00      1.00      1685
           1       1.00      1.00      1.00       985
           2       0.96      0.93      0.95       584
           3       0.93      0.98      0.95      1121
           4       0.99      0.99      0.99      2351
           5       0.97      0.84      0.90       216

   micro avg       0.98      0.98      0.98      6942
   macro avg       0.98      0.96      0.97      6942
weighted avg       0.98      0.98      0.98      6942
 samples avg       0.98      0.98      0.98      6942