Exercise: XOR problem in QGIS
For issues, bugs, proposals or remarks, visit the issue tracker.
Tutorial Data Set
We will use two images:
- xor_training.tiff for training and
- xor.tiff for predicting.
Goal
We will solve the XOR problem (see context) with the MLP Classifier.
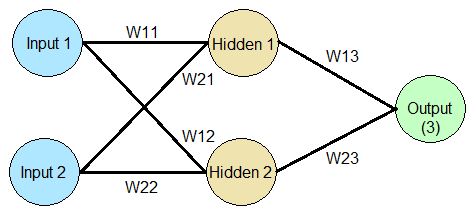
In order to do this, we will need a Neural Network with 3 layers: an input layer with 2 input neurons, a hidden layer with 2 neurons and an output layer with one neuron.
We will however not do a normal classification. Instead, we will calculate the probability for each input that the output is class 1! Have another look at the training data, we have two classes: class 1 and class 2.
Run the Neural Network MLPClassifier in QGIS
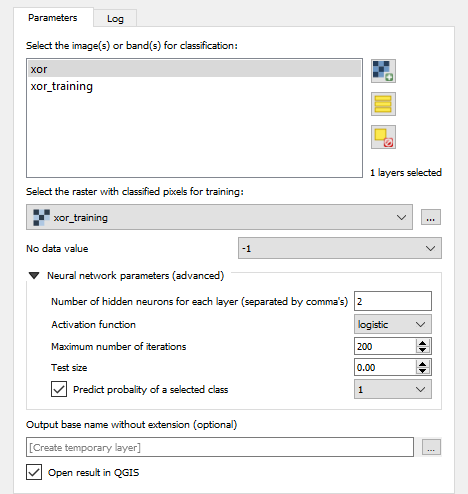
We need the following input for the GUI:
- The image for classification: xor
- The raster for training: xor_training
- The no-data-value is -1
- Number of neurons for each hidden layer: 2 neurons in 1 hidden layer
- Test size: 0
- We want the probability of class 1 (we have two classes, 1 and 2)
- Output file path
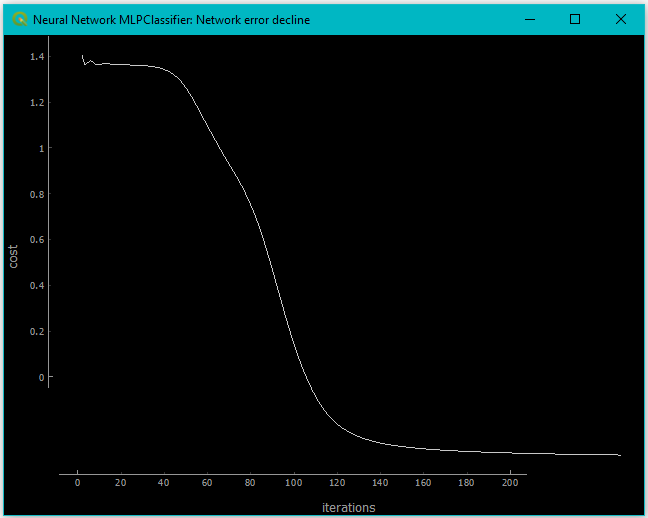
After the training, the network error is shown as a plot like:
The resulting image should look something like this:
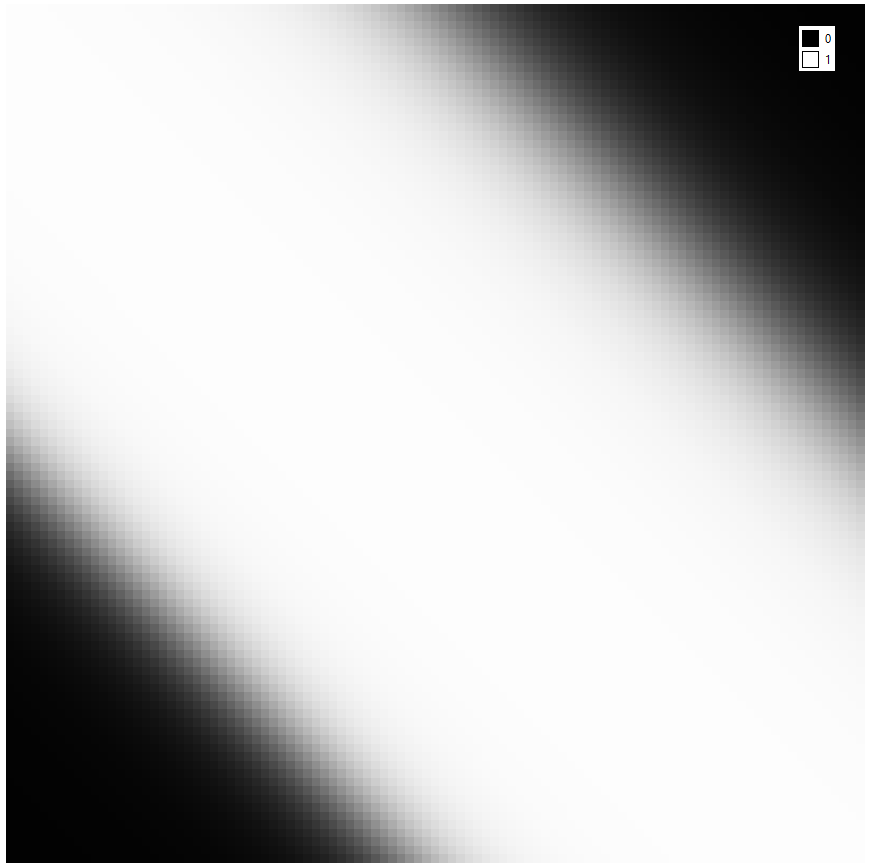
Probability of each pixel being class 1, ranging from 0 (black, zero probability) to 1 (white, max certainty)
In theory there are two decision surfaces, the image above only shows one. Can you explain?